1.6 CellProfiler Module
Overview
The CellProfiler module allows to execute arbitrary CellProfiler pipelines on single images or datasets of images. Pipeline parameters can be changed and parameter value lists can be provided to experiment with parameter variations. The results are stored back in BisQue as Gobjects, tables, or images.
Uploading of CellProfiler Pipelines
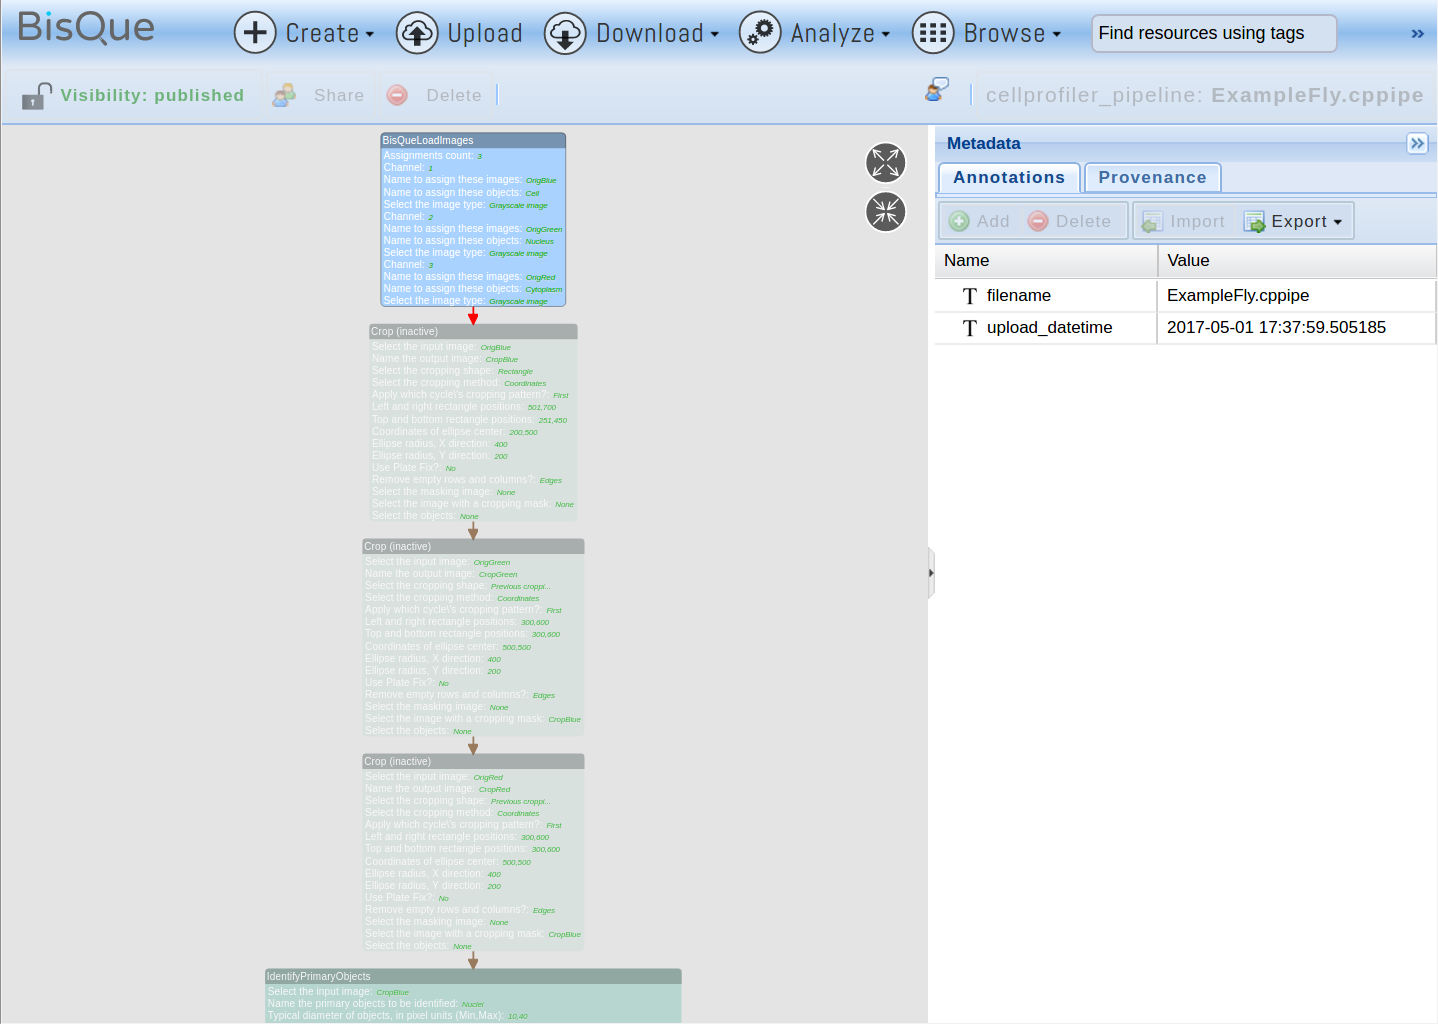
Most CellProfiler pipelines can be uploaded and used directly without modifications. In order to upload a pipeline, click Upload, select the pipeline file, and click Upload. If the file extension is .cp or .cppipe, the file will automatically be recognized as a CellProfiler pipeline. In order to verify the pipeline, it can be opened by browsing the cellprofiler_pipeline resources and opening the recently uploaded pipeline. It will look like this:
ImageJ Pipeline
Each box represents one CellProfiler module and the arrows indicate the pipeline flow through the modules. Note that some boxes have different colors. For example, the first box (BisQueLoadImages) is shown in blue to indicate that the original module(s) from the pipeline have been replaced with a BisQue specific component that allows to read images directly from BisQue. These pipeline conversions happen automatically when the pipeline is uploaded into BisQue. The next three steps in the pipeline are shown in transparent color to indicate that they were inactivated. Certain operations (such as Crop in this example) are not currently compatible with BisQue and are ignored without affecting the rest of the pipeline. Green boxes indicate regular CellProfiler modules that were kept unchanged. Red boxes indicate incompatible operations that could not be modified and will render the pipeline non-executable. The pipeline can be modified to replace the operations in red with other steps and the pipeline re-uploaded to fix this problem.
Running a CellProfiler Pipeline
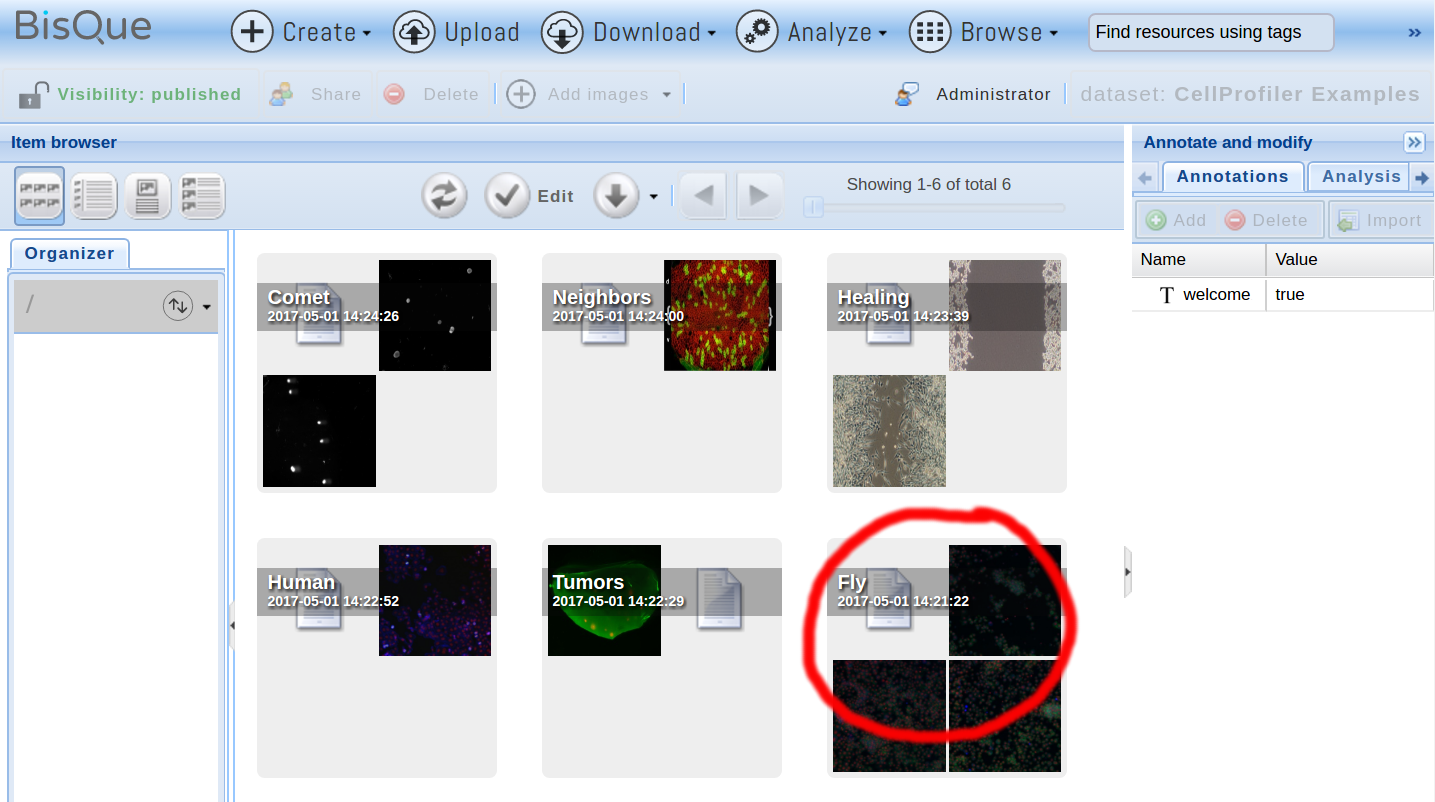
In order to demonstrate how to run a CellProfiler pipeline, open the ExampleFly.cppipe pipeline that can be found in the public Fly dataset inside the CellProfiler Examples dataset (please ensure to check Show public data in the options menu on the top right; otherwise, you will not see these resources):
ImageJ Pipeline
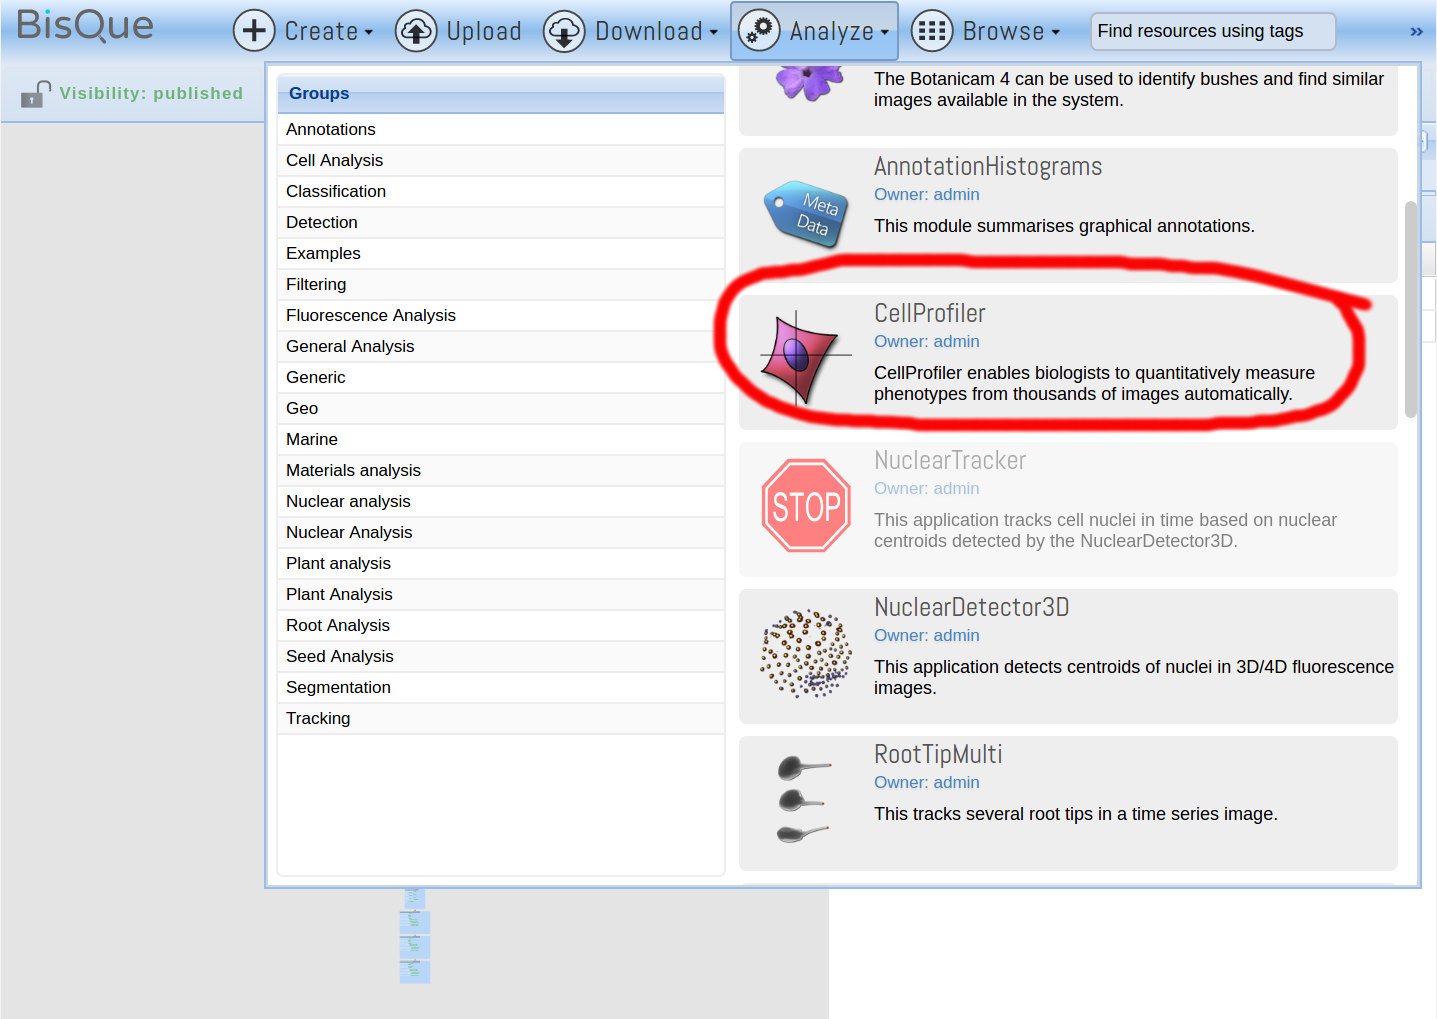
After viewing the pipeline, click on Analyze and then on CellProfiler:
ImageJ Pipeline
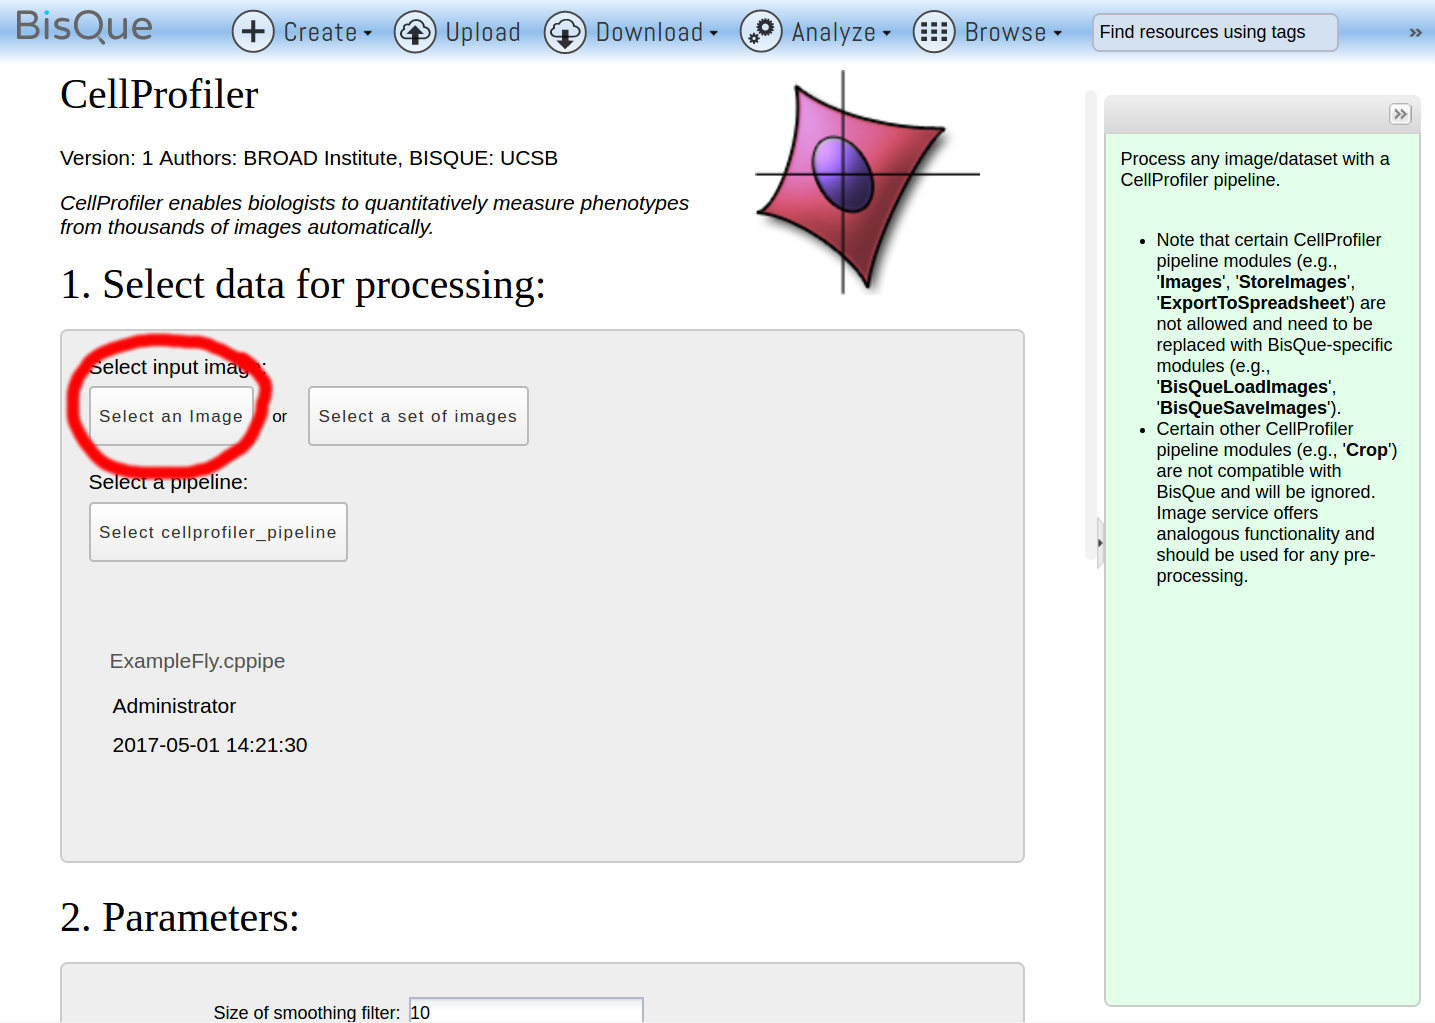
The CellProfiler module page opens. Click Select an Image to choose a single image to run the pipeline on (alternatively, a dataset of images can be selected to run the pipeline on multiple images in parallel):
ImageJ Pipeline
For this example, we use the image CPExample Fly1. Note that the pipeline expects a three-channel image as input (this can be seen in the BisQueLoadImages step at the beginning of the pipeline). Next, modify any pipeline parameters if desired in section 2 (the values shown are the defaults found in the pipeline). Besides single parameters, this module also allows lists of parameters to be entered. For example, for Size of smoothing filter, one can enter \([10,20,30]\) to run the pipeline with all three smoothing filter settings in parallel. This allows to study the effect of this parameter on the final output.
Finally, click the Run button to start the pipeline execution.
Results
Once the execution finishes, the pipeline outputs are shown in section 4:
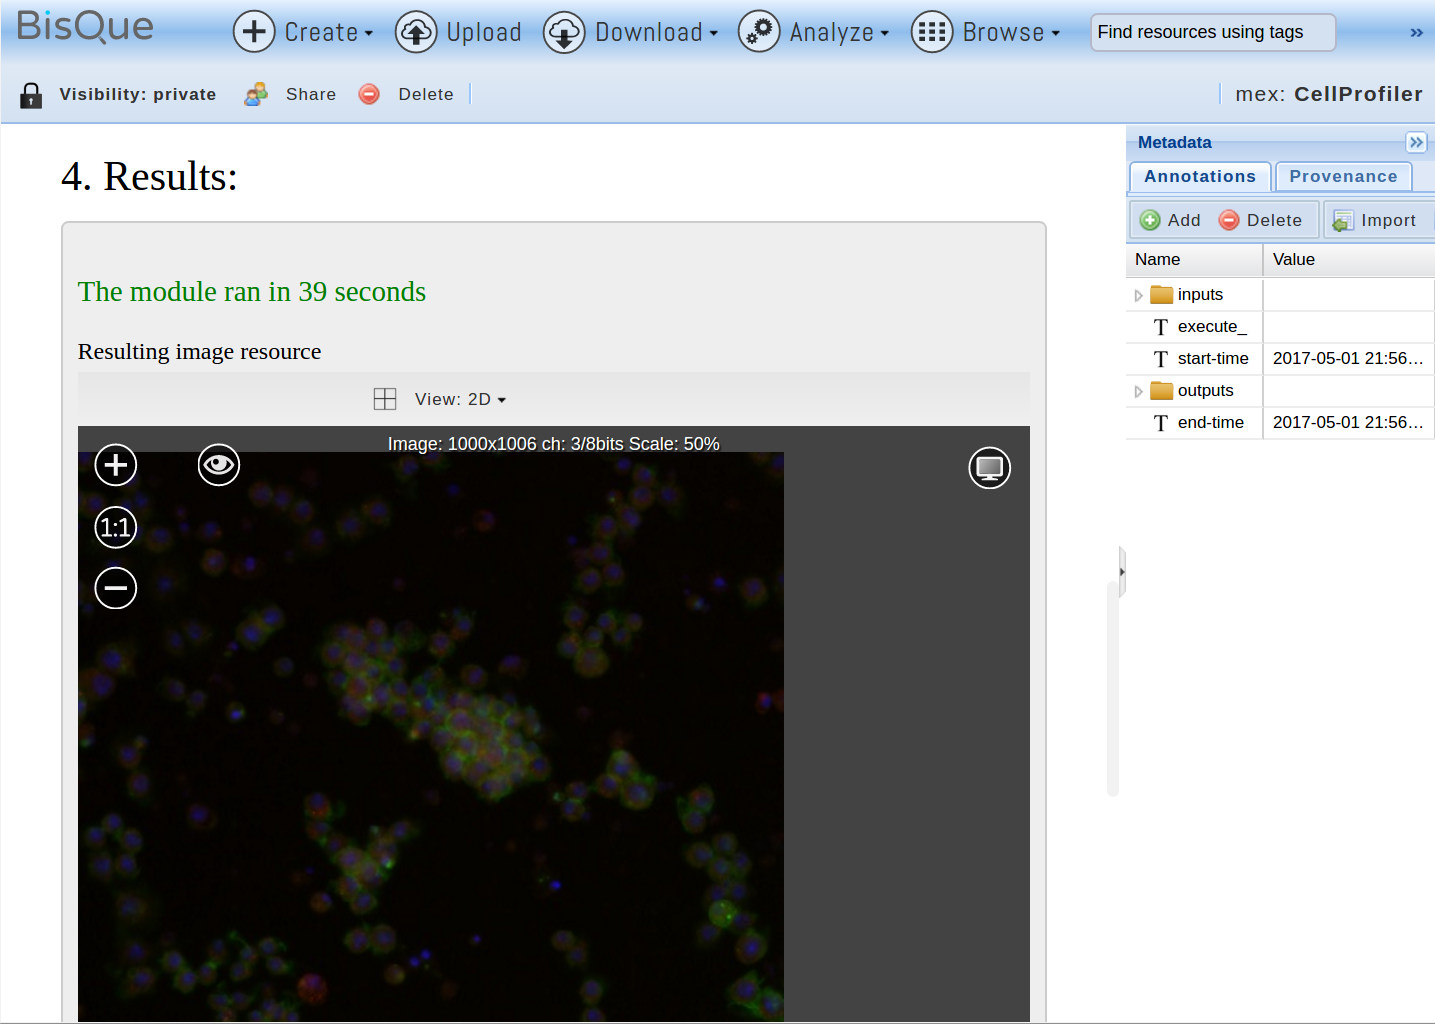
ImageJ Pipeline
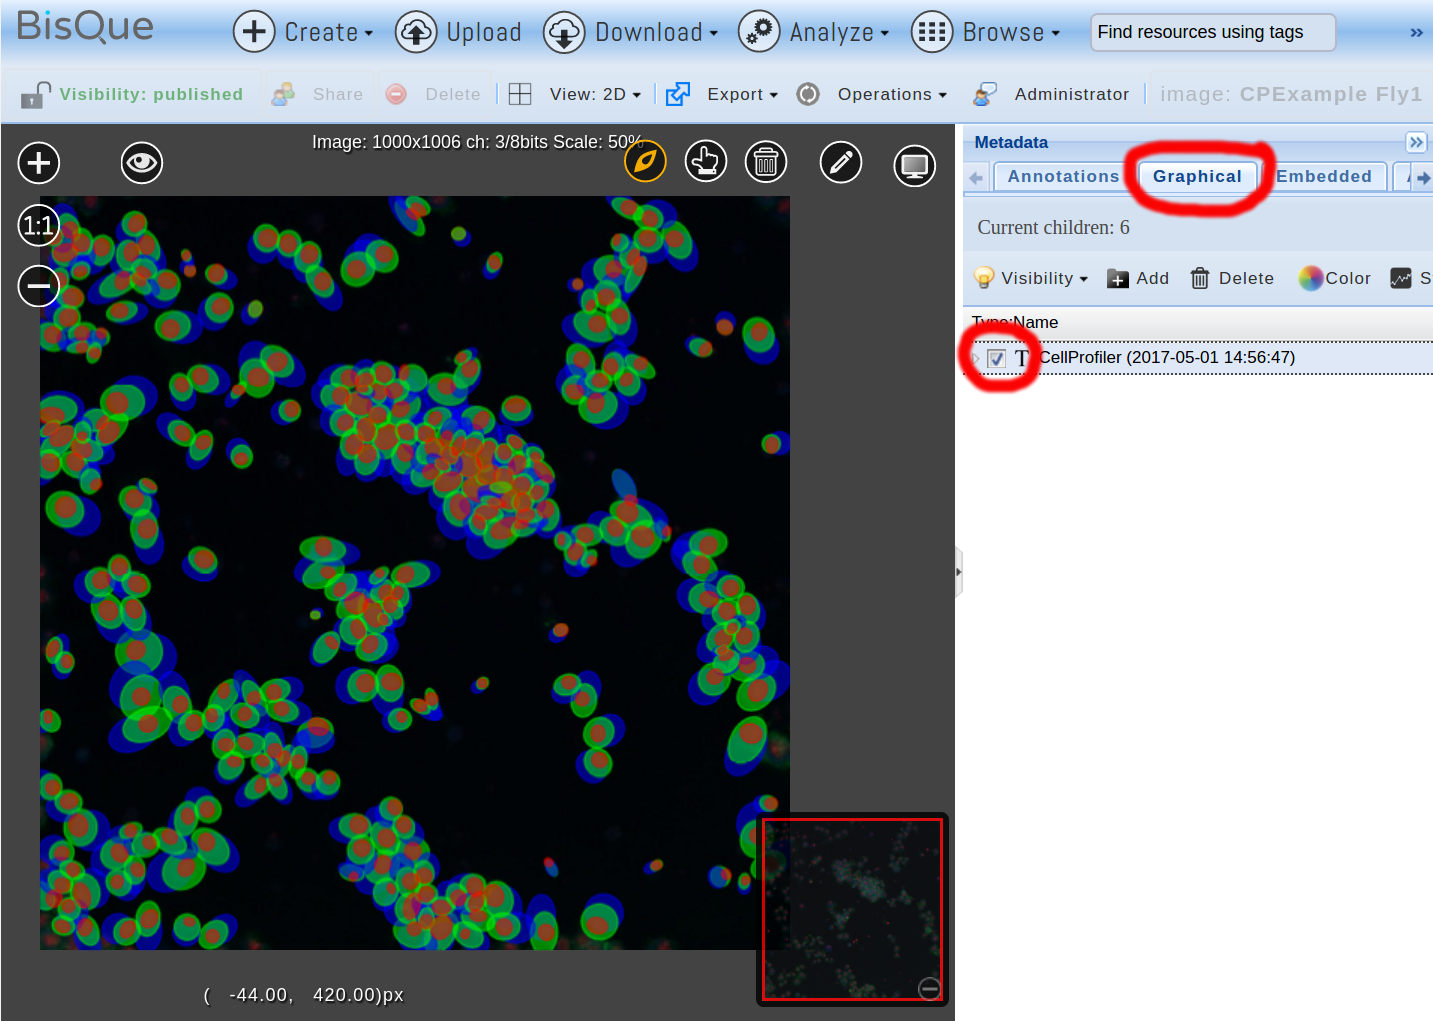
In this case, one image and one table are generated. Additionally, Gobjects are created by a BisQue specific pipeline step BisQueExtractGObjects towards the end of the pipeline. This step reads certain columns from a generated table and interprets them as GObject parameters (in this case, ellipse coordinates and minor/major axis). The generated GObjects are stored as part of the Mex document, as with any other module. In order to view the Gobjects, open the input image (CPExample Fly1) again and under the Graphical tab, check the top-most CellProfiler line (representing the last module run). This displays three types of ellipses overlayed over the image, one for detected nuclei, one for the cell boundaries, and one for the detected locations of cytoplasm:
ImageJ Pipeline
The GObjects were generated by the three BisQueExtractGObjects steps at the end of the pipeline, one for objects from the “Nuclei” table, one for objects from the “Cells” table, and one for objects from the Cytoplasm table. The colors were set in these steps as red, green, and blue respectively. By hovering with the mouse pointer over any of the Gobjects, additional statistics are displayed.
The generated tables and Gobjects can now be processed further in additional BisQue modules or shared with other users.