1.7 Plant Cell Segmentation
Overview
This module is for segmenting 3D membrane tagged cell images. The workflow is as follows: 3D UNet to output the probability map of a cell boundary, 3D watershed to get the initial cell label, and 3D Conditional Random Field (CRF) to refine the segmentation label.
CellECT 2.0 Module Homepage
Using the Analyze tab on BisQue, you should see the Cell Segmentation 3D UNET module. Click on it and you should see a landing page like this.
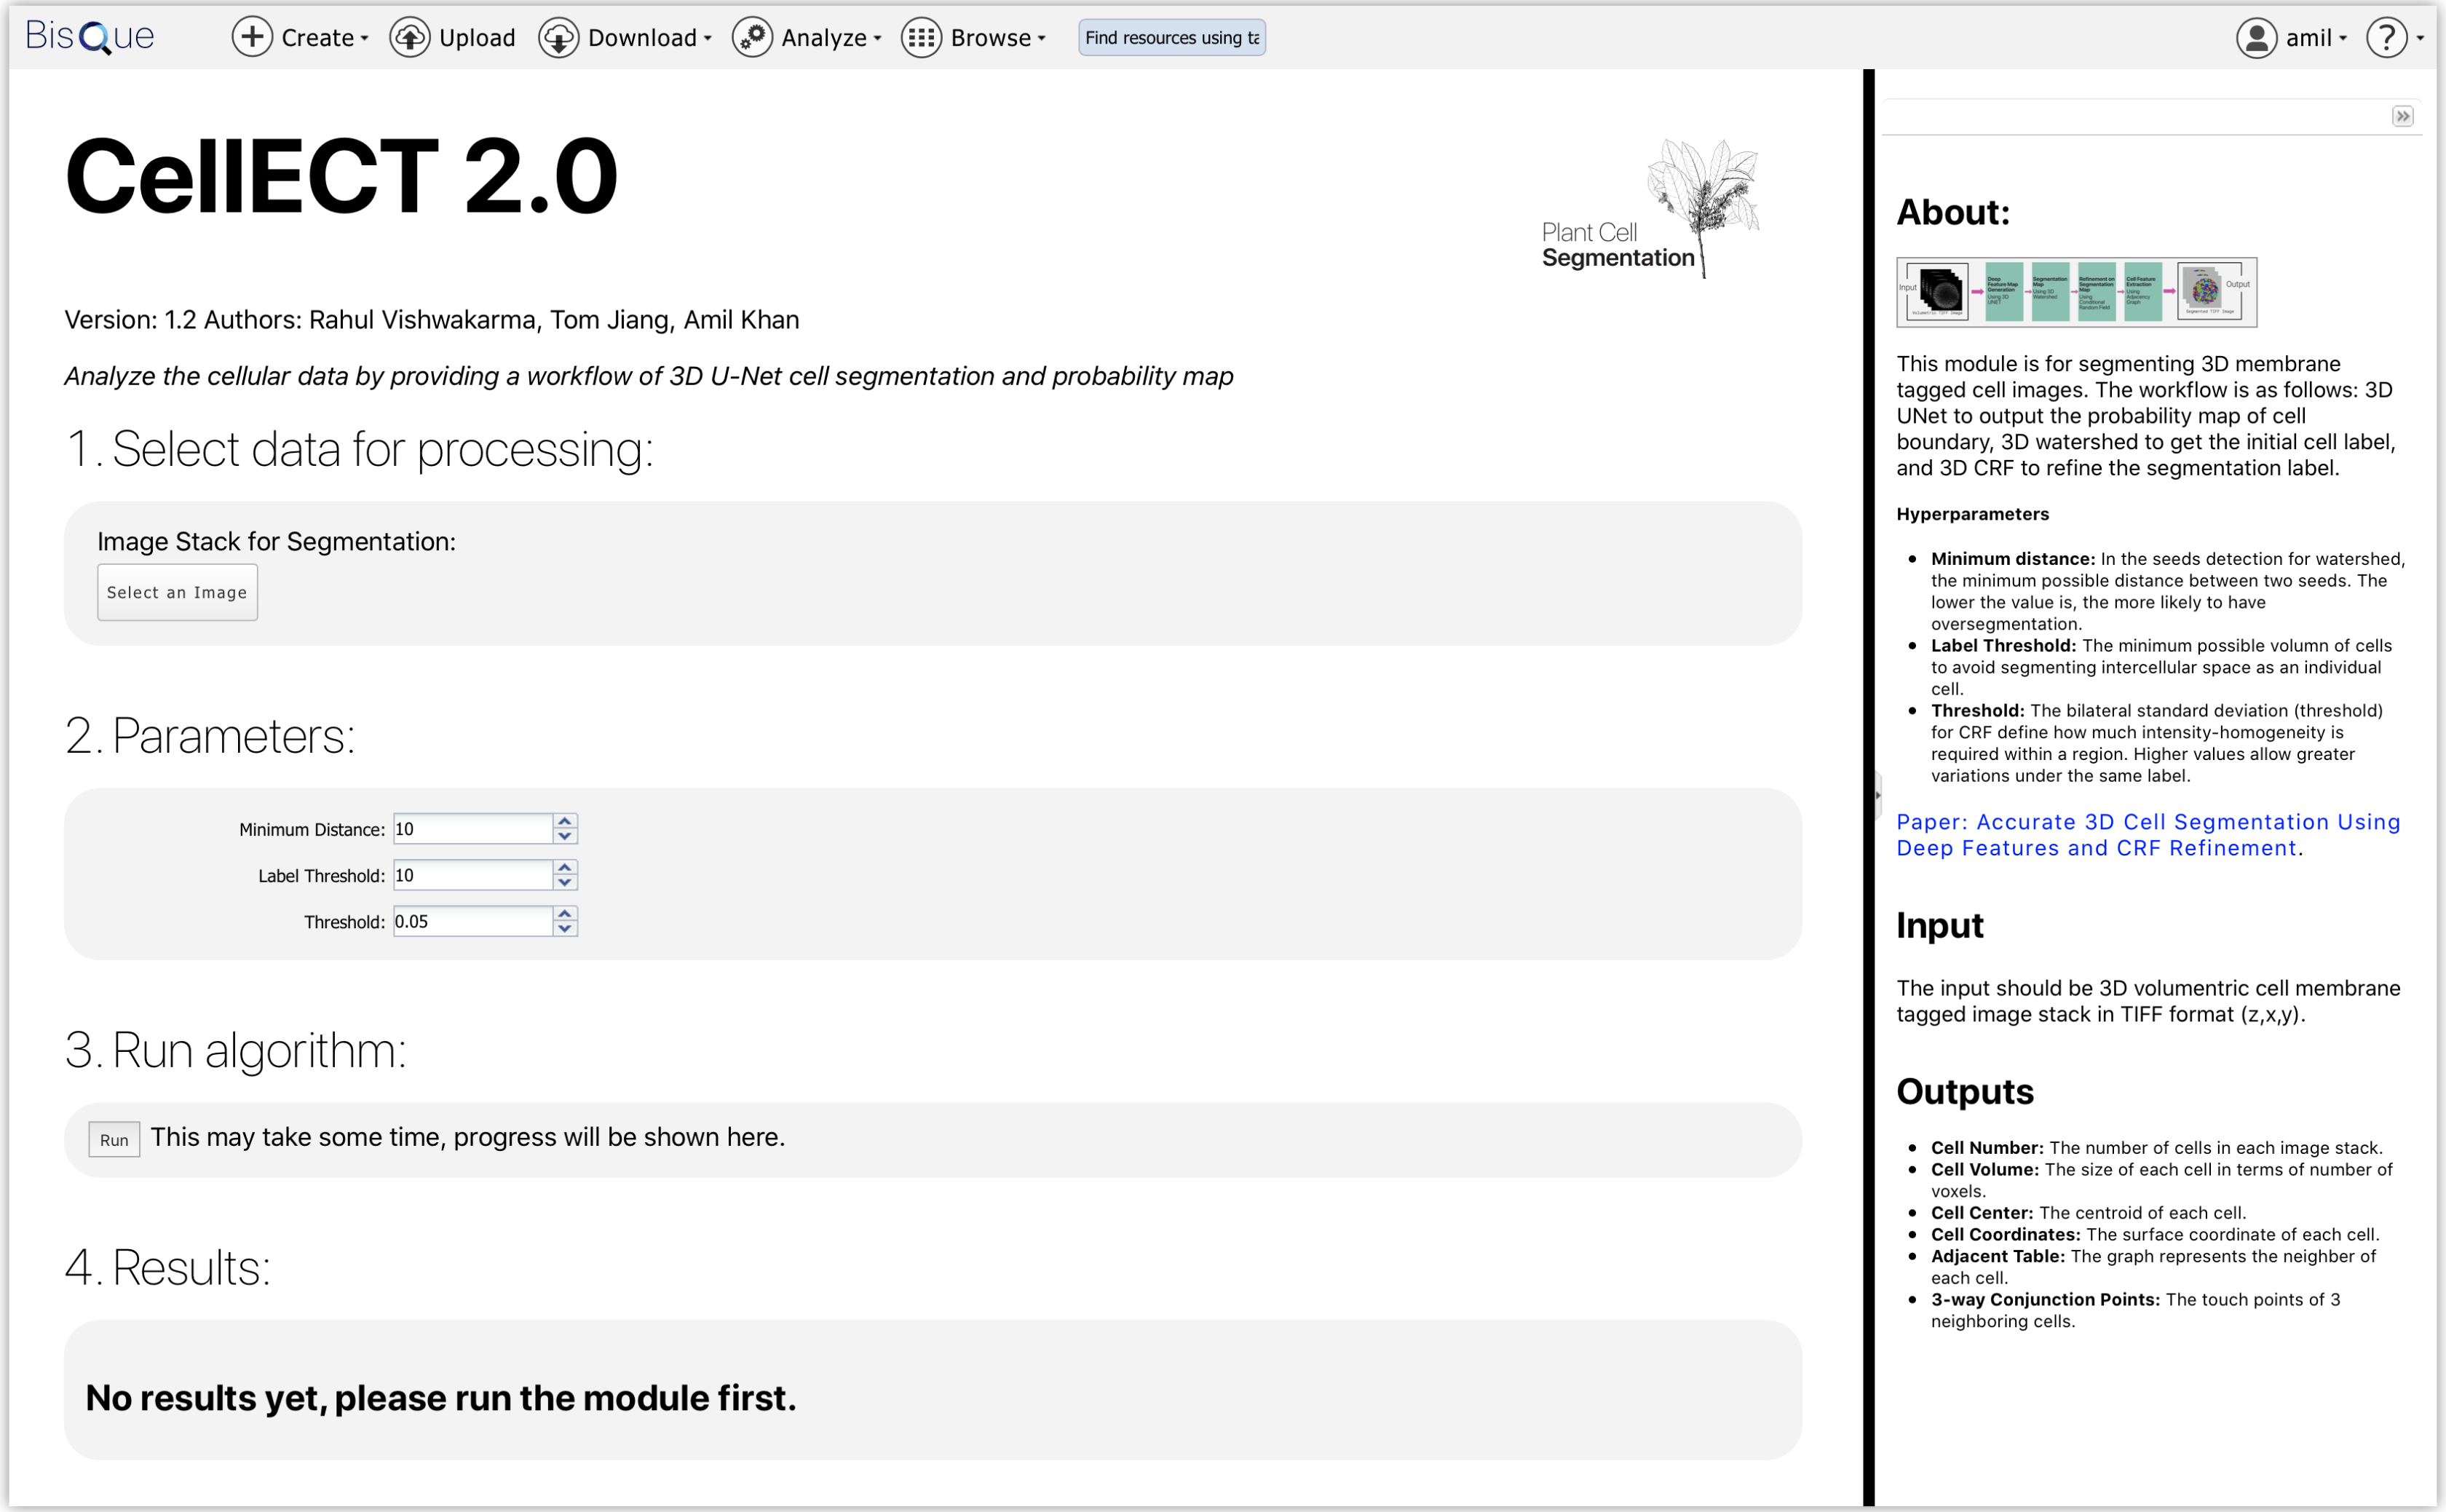
CellECT 2.0 Module Homepage. Here is the landing page for the GPU-enabled CellECT 2.0 module.
Algorithm Workflow Diagram
By using 3D UNET on the backend, we are able to segment the 3D volumes of the cells. We then create the segmentation map and use a Conditional Random Field (CRF) to further refine the segmentation map. Lastly, we use the information from the algorithm to extract features about the cells such as volume, surface coordinates, and many others.

CellECT 2.0 Workflow. The Plant Cell Segmentation Workflow from the algorithmic view.
Module Integration Workflow
The module workflow consists of a source code folder with information on how to run the algorithm. We can then Dockerize the source code folder using a base image that includes the necessary CUDA libraries and dependencies and beginning testing whther the source code runs inside the container. Thereafter, we deploy the module on BisQue for public usage.

Module Integration Workflow. Workflow for integrating the Plant Cell Segmentation module.
Input

Sample Plant Cell Images. These images are taken from time series data stored in TIFF files.
TIFF Imagewith minimum \(z > 1\)
Hyperparameters
Threshold- The bilateral standard deviation (threshold) for CRF define how much intensity-homogeneity is required within a region. Higher values allow greater variations under the same label.Label Threshold- The minimum possible volume of cells to avoid segmenting intercellular space as an individual cell.Minimum Distance- In the seeds detection for watershed, the minimum possible distance between two seeds. The lower the value is, the more likely to have over-segmentation.Minimum Cell Size- Minimum size to be considered a cell
Cell Features
Cell Number- The number of cells in each image stack.Cell Volume- The size of each cell in terms of number of voxels.Cell Center- The centroid of each cell.Cell Coordinates- The surface coordinate of each cell.Adjacency Table- The graph represents the neighbor of each cell3-way Conjunction Points- The touch points of 3 neighboring cells
Output
Segmented TIFF ImageHDF5 Table with Cell Features
| CellNumber | CellVolume | CellCenter | SegmentedImage | SurfaceCoordinates |
|---|---|---|---|---|
| 1 | 9832 | [5, 57, 5] | SEGMENTED TIFF as ARRAY | ARRAY of Surface Coordinates |
| 2 | 2387 | [5, 87, 5] | SEGMENTED TIFF as ARRAY | ARRAY of Surface Coordinates |
| 3 | 945 | [5, 23, 5] | SEGMENTED TIFF as ARRAY | ARRAY of Surface Coordinates |
| 4 | 2843 | [5, 38, 5] | SEGMENTED TIFF as ARRAY | ARRAY of Surface Coordinates |
| 5 | 1029 | [5, 27, 5] | SEGMENTED TIFF as ARRAY | ARRAY of Surface Coordinates |